
Data: supporting sustainable mobility
DAT4ECOPS is part of the Plan to Promote Sectoral Data Spaces, a strategic initiative promoted in the context of the Recovery, Transformation and Resilience Plan (PRTR) of the Government of Spain, financed by the European Union through the Next Generation EU funds and coordinated by the Secretary of State for Digitalisation and Artificial Intelligence (SEDIA), of the Ministry for Digital Transformation and Public Function.
In this context, the project aims to improve the sustainability of rail transport through the intelligent use of operational data. To achieve this, the following activities are carried out:
- To develop a scalable and secure data technology platform, capable of integrating different sources, both of track and on-board equipment.
- To use this platform in an iterative process for the energy optimisation of rail traffic, consisting of three stages:

Ingestion of operation data and calculation of driving metrics
The first stage of the process requires a data technology platform, developed to perform the daily ingestion, storage, transformation, analysis and visualization of the necessary operating data.
Ingestion consists of the daily collection of raw operating data from both on-board systems and track infrastructures, which are automatically transmitted to centralized storage in the cloud. The quality and frequency of data sampling is a critical factor that will condition subsequent analyses. With variables such as the position, speed, traction forces and power of the trains during operation, the necessary metrics for the following stages of the process are calculated.
Raw data is stored in scalable, properly partitioned repositories to make it easier to manage large volumes of data. They are then processed through validation, standardization of formats, homogenization, categorization and integration functions, obtaining a catalogue of data suitable to be analysed.
The analysis is carried out automatically and daily on this data catalogue, first identifying the different pipes made by the trains during operation and then calculating the metrics that describe each of them; duration, energy consumption, traction, drift and braking percentages, etc.
Finally, the data technology platform shows the calculated metrics through dashboards made up of different visualizations that allow the user to interpret the information and redesign the pipelines in the next stage of the process.
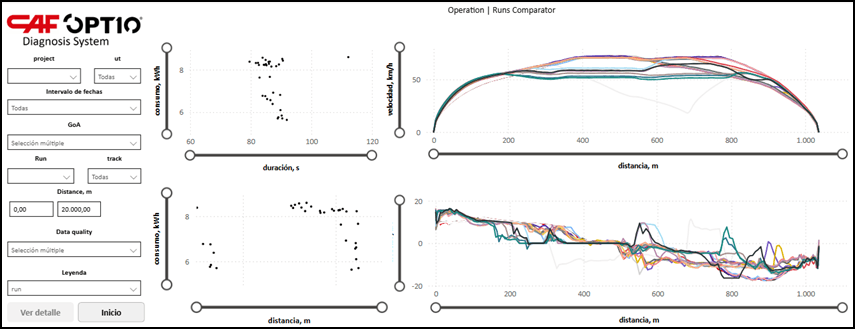 Pipeline metrics dashboard.
Analysis of metrics and redesign of pipes
Once the metrics associated with each pipeline have been obtained, this stage consists of comparing them journey by route, observing the energy saving potentials associated with both the increase in travel time and the implementation of efficient pipelines.
This project has been carried out using operating data from a metro line corresponding to a linear section operated in both directions. The following scatterplot shows the pairs of values for journey time and energy consumption associated with various pipes on one of the routes. In it you can see both energy saving potentials; on the one hand, the one derived from increases in travel time and, on the other, the one associated with efficient driving strategies. Pipeline 1 corresponds to the shortest travel time, while pipelines 2 and 3, with very similar durations, present significant differences in their energy consumption.
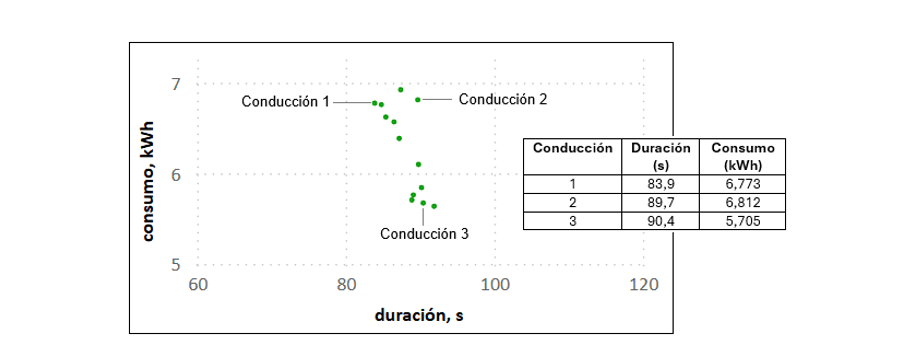
Driving 3, with a duration 7.7% longer than driving 1, shows a reduction in energy consumption of 15.7%; reflecting the potential associated with increased travel time. Likewise, with a duration almost identical to that of driving 2, it reduces energy consumption by 16.2% less than the latter; evidencing the potential associated with the application of efficient pipelines.
The following graph shows the speed and effort curves of the three previous pipelines which, together with the metrics obtained, allow the redesign of the travel times of commercial routes, as well as the definition of optimal speed and effort curves to minimize energy consumption without compromising the quality of service (punctuality, comfort, etc.).
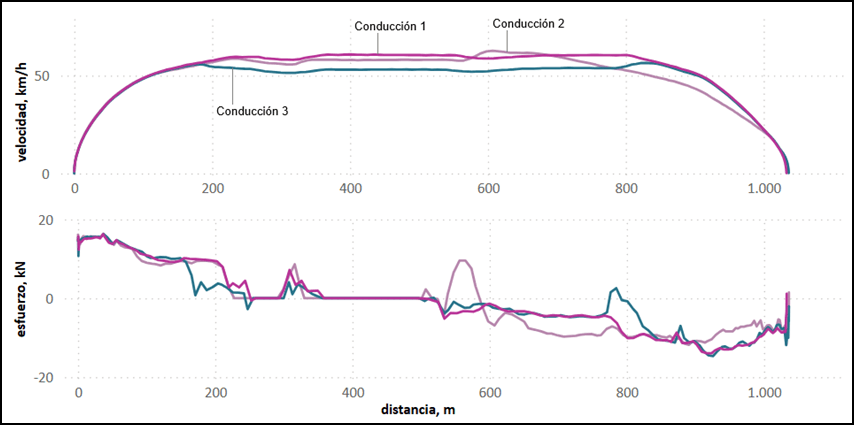 Speed and tractive effort curves.
Implementation of new pipelines
Once the new candidate pipelines have been selected in each of the routes of a commercial service, the third stage consists of their implementation during operation. This implementation allows the acquisition of new operating data, thus closing the iterative process for the energy optimization of rail traffic.
*Funded by the European Union – NextGenerationEU. However, the views and opinions expressed are solely those of the author(s) and do not necessarily reflect those of the European Union or the European Commission. Neither the European Union nor the European Commission can be held responsible for them.

 .
.